 Above are Star plots of 1979 Automobile analysis.
Friday, August 8, 2008


Triangular plot

The Triangular plot above shows the estimated fraction of the population intending to vote for each of the major parties
Windrose

Above is a Windrose showing the relative frequency of directions from where the wind is coming from.

Population profile

Above is a Population profile illustrating the population profile for Australia's Northern territory from 1986-1995.

Index value plot

Above is an example of an Index value plot is "of Average Streamflow Index, plotted as the red line on the above graphs, is calculated each day as the average of the streamflow index values for all the stream gaging stations in the state or water resource region having at least 30 years of record".
Accumulative line graph or Lorenz curve
 Above is an example of an Accumulative line graph or Lorenz curve.
Thursday, August 7, 2008

Nominal Area choropleth map

Above is an example of a Nominal area choropleth map of the "California % Black Condo Owners".

Standardized Choropleth map
 http://www.bbc.co.uk/scotland/education/bitesize/standard/img/geography/population/g156.gif
Above is a Standardized Choropleth map of the world's population density.
Univariate Choropleth map
 http://www.cartisan.com/map_resources/map_types/images/choropleth.jpg
Above is a Univariate Choropleth map of the percentage mean for each states electoral votes for the 2004 presidential election. This map may also be considered a propaganda map.
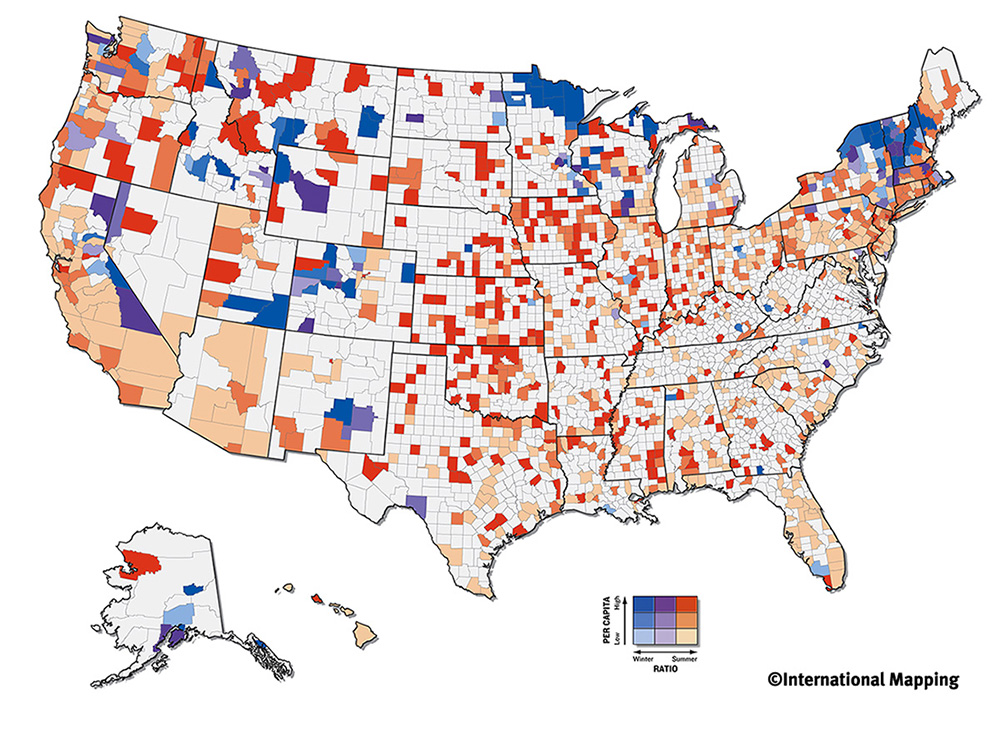
Bivariate Choropleth map
http://www.directionsmag.com/images/articles/sportsillustrated/Olympic_Athletes.jpg
Above is a Bivariate choropleth map of U.S. Olympic Athletes' home areas, based on high(darker shades) or low (lighter shade) per capita and winter(blue) and summer(red) olympic athletes.
Unclassed Choropleth Map

http://www.blogger.com/post-edit.g?blogID=6932841296169209324&postID=1035458377811982688
Above is an example of an Unclassed Choropleth Map of the 2006 percentage of population 14 years or younger in Canada.
Tuesday, August 5, 2008
Classed Choropleth maps
 Above is a Classed Choropleth map of Percentage of individuals living in poverty, by county in the United States in 2000.
Range graded proportional circle map
 http://pubs.usgs.gov/fs/fs-004-03/
The Range graded proportional circle map above is of river characteristics discovered during the Lewis and Clark expedition.
Continuously variable proportional circle map

http://www.lib.utexas.edu/maps/europe/west_germany_ind_1972.jpg
Above is an example of a Continuously variable proportional circle map.
DOQQ or Digital Orthophoto Quarter Quadrangle
 http://www.tceq.state.tx.us/assets/public/gis/images/doq_ut.gif
Above is a DOQQ or Digital Orthophoto Quarter Quadrangle of the Texas Longhorn's stadium.
DOQQ or Digital Orthophoto Quarter Quadrangle is an aerial color photograph using infrared light.
Monday, August 4, 2008
DEM or Digital Elevation Model

http://hawaii.wr.usgs.gov/maui/image/map/maui_map.gif
Above is a DEM of Maui and color-coded oblique view looking northwestward.
DEM or Digital Elevation Model is digital representation of ground surface topography or terain.
DLG or Digital Line Graphic

http://gis.esri.com/library/userconf/proc00/professional/papers/PAP691/p6911.gif
Above is an example of a DLG.
A DLG or Digital Line Graphic is a digital illustration the different cartographic information on a USGS topographic map.
DRG or Digital Raster Graphic map

http://erg.usgs.gov/isb/pubs/factsheets/fs08801.graphics/drg.jpg
Above is a DRG of West side of Washington D.C.
A DRG or Digital Raster Graphic map is a digital image of a USGS topographic map that has been scanned for computer use.
Isopleths

Above is an Isopleth of the Ammonium ion concentration, 2006
Isopleths are maps that illustrate connecting points of equal value or amount value of some variable at a given time and spatial area.
Isopleths are maps that illustrate connecting points of equal value or amount value of some variable at a given time and spatial area.
Isopach
 http://pubs.usgs.gov/of/2006/1179/Data_layers.html
The Isopach above is of the thickness of Hauterivian sandstones in northern Afghanistan .
Isopach on a map display points of equal amounts of sediment and rock thickness.

Isotachs
 http://www.wrh.noaa.gov/wrh/SLCw38.jpg
 An example of Isotachs over the western United States.
Isotachs are contour lines that display points of equal wind velocity.
Isobars
 http://www.weatherchannel.com.au/Magic94scripts/mgrqispi94.dll?appname=WC&prgname=WC&Function=Maps&Map=Syn
Above is an example of Isobars showing the different levels of air pressure above Australia.
Isobars are illustrated by contour lines which display the different levels of air preassure in the atmosphere; these maps are used as part of the weather predicting process.
LIDAR image

Above is an example of a LIDAR image.
A LIDAR image (Light Detection and Ranging), employs measurements of laser lights beamed into the atmosphere in order to define and detect and measure the distance between ground station and the vegetation canopy or building tops.
Doppler Radar
 http://www.noaanews.noaa.gov/stories/s1192.htm
Above is a Doppler Radar image taken on July 2003 of Hurricane Claudette making landfall in Houston, TX.
The Doppler Radar uses the doppler shift to measure the change in frequency and wavelength of moving objects; such as weather phenomena.
Black and White Aerial Photo
 http://freegeographytools.com/wp-content/uploads/2007/09/doq.jpg
 Above is an example of a Black and White Aerial Photo.
Infrared Aerial Photo
 http://www.aerialarchives.com/Infrared-Aerial-Photography.htm
Above is an Infrared Aerial Photo of the Sacramento Deep Water Channel.
An Infrared Aerial Photo can be used to document changes in the enviornment and as well as changes in many other types of applications.
Cartographic animations
 http://maps.unomaha.edu/AnimArt/ActiveLegend/Peterson.html
The Cartographic animation above is of the percentage of deaths by population for the state of Nebraska, 1996.
Cartographic animations illustrate the movement of geographical phenomena that develops within specific topics.
Statistical map

The Statistical map above represents the percentage change in population for all 50 states, District of Columbia and Puerto Rico.
A Statistical map is also known as a distribution map; illustrates the distribution of specific variables within a geographic area.
Cartograms
 http://pthbb.org/natural/footprint/img/cartogram.png
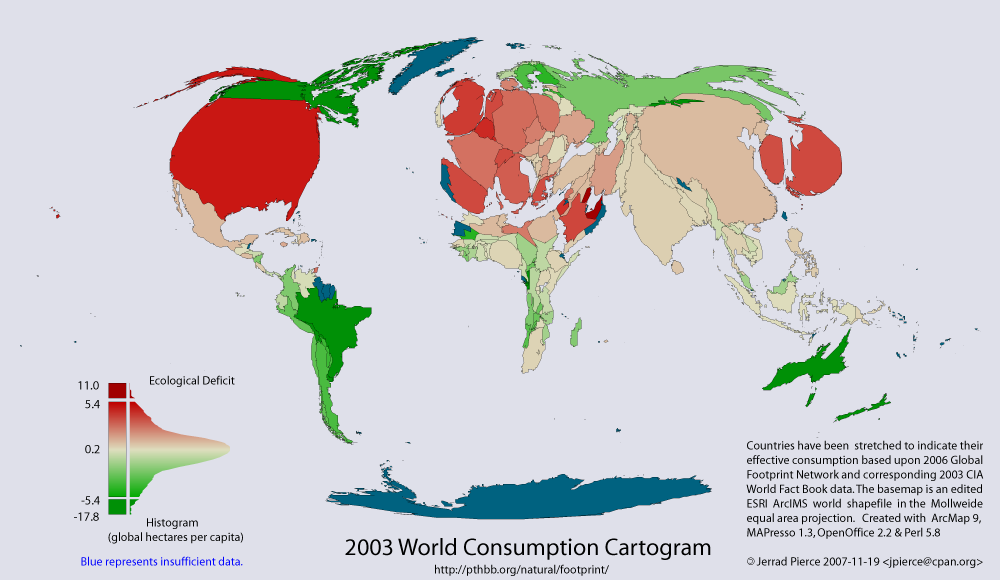
Above is the 2003 WorldConsumption Cartogram. Based on the 2006 Global Footprint Network and corresponding 2003 CIA World Fact Book data. The basemap is an edited ESRI ArcIMS world shapefile in Mollweide equal area projection. Created with ArcMap9, MAPresso 1.3, Open Office 2.2. & Perl 5.8 Jerrad Pierce 2007-11-19 jpierce@cpan.org
A Cartogram is a map which employs abstract illustrations that are not to scale in order to represent detailed statistical data.
Sunday, August 3, 2008
Flow map
 The Flow map above displays the movement of freight transported over water from Hawaii to the United States for 1998.
A Flow map is used to illustrate the movment of specific data from one location to another.
Isoline map

http://www.waterpowermagazine.com/graphic.asp?sc=2049536&seq=6
The above is from the International Water Power and Dam Construction; it "illustrates the temperature Isoline Map at crown section during operation period (January 31, 2005); Right: Figure 9 – The temperature isoline map at dam vertical section during operation period (January 31, 2005)
An Isoline map employ continuous lines with joining points of the same value in order to illustrate identical information in different geographical and atmospheric conditions.
Proportional Circle map
 http://www.neiu.edu/~jrthomas/377/circle.jpg
Above is a Proportional Circle map of the Mexican population in Western United States in 1990.
Dot Distribution map

Above is a Dot Distribution map of the 2000 populaton distribution of the United States. Each dot represents 7500 people. A Dot Distribution map basically uses dots to represent numerical data for specific geographical regions and areas.
Choropleth map

The Natioanla Highway Traffic Safety Administration :
Above is a Choropleth map of California's 2006 alcohol related fatalities by county. A Choropleth map is a thematic map in which colored or shaded areas are in direct proportion to the measurement of the numerical or statistical information.
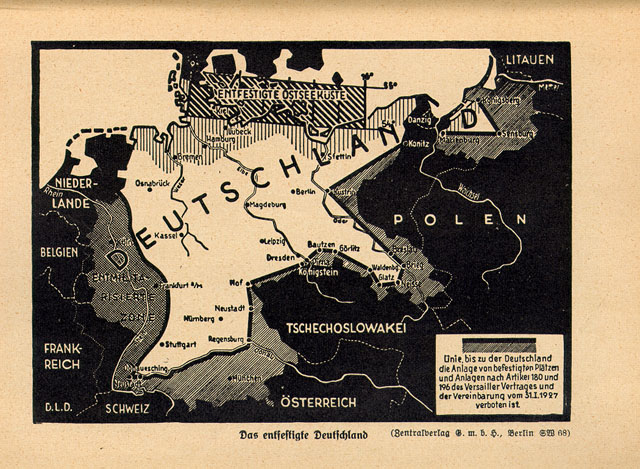
Propaganda map

http://www.calvin.edu/academic/cas/gpa/images/heer/heer1.jpg
The above is a Propaganda map from a "1935 book titled 'Army, Navy and Air Force', a small book that wanted to demonstrate that Germany was surrounded by hostile countries". The title of this map is "Demilitarized Germany"; which displays the demilitarized regions that were imposed under the Treaty of Versailles.
A Propaganda map is used to influence people for political or social reasons by manipulating or distorting the facts on the map.
Friday, August 1, 2008
Hypsometric map
 http://www.rrcap.unep.org/centralasia/reapreport/Map/MOUNTAIN/map_2.jpg
Above is a Hypsometric map of Tajikistan ; the dark red color represents the highest elevations, while the green represents. A Hypsometric map is a map that is used to illustrate topographic surveys. This type of map displays the different elevations by different means; such as shading, coloring, tinting or even contours.
Subscribe to:
Posts (Atom)