http://www.waterpowermagazine.com/graphic.asp?sc=2049536&seq=6
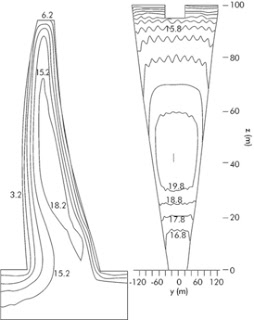
The above is from the International Water Power and Dam Construction; it "illustrates the temperature Isoline Map at crown section during operation period (January 31, 2005); Right: Figure 9 – The temperature isoline map at dam vertical section during operation period (January 31, 2005)
An Isoline map employ continuous lines with joining points of the same value in order to illustrate identical information in different geographical and atmospheric conditions.
No comments:
Post a Comment