skip to main | skip to sidebar

Map Catalog for Dummies

Thursday, August 7, 2008

Bivariate Choropleth map


http://www.directionsmag.com/images/articles/sportsillustrated/Olympic_Athletes.jpg
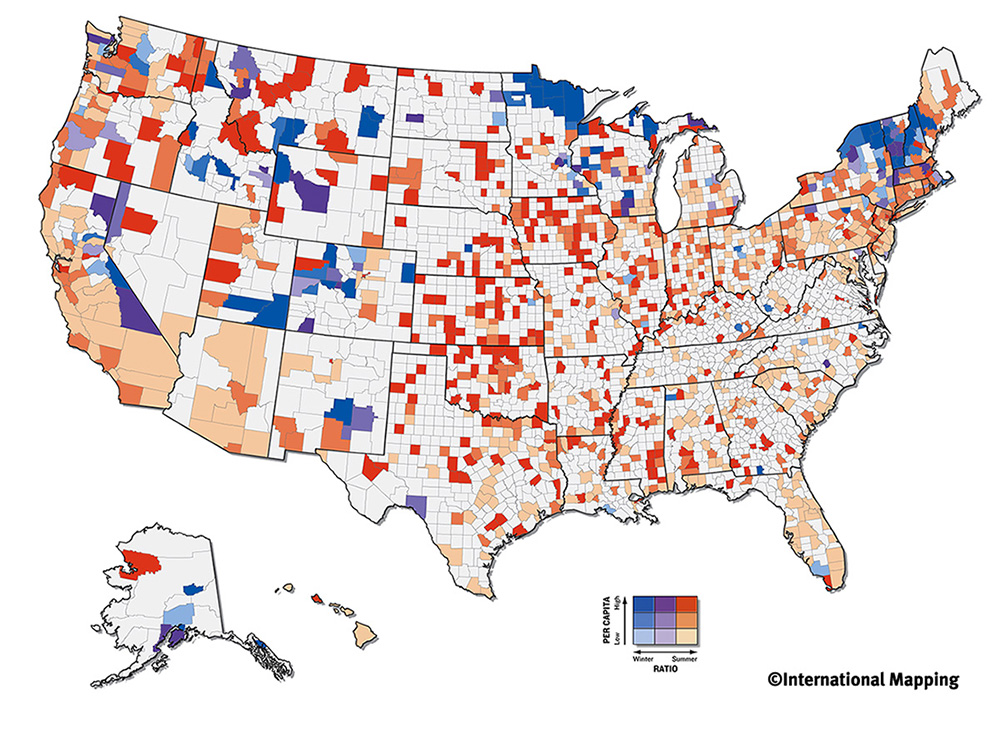
Above is a Bivariate choropleth map of U.S. Olympic Athletes' home areas, based on high(darker shades) or low (lighter shade) per capita and winter(blue) and summer(red) olympic athletes.
Posted by Captain Cook's Navigator at 11:26 PM

No comments:

Post a Comment

Newer Post Older Post Home
Subscribe to: Post Comments (Atom)

Blog Archive

  • ▼  2008 (50)
    • ▼  August (44)
      • Star plots
      • Box plot
      • Histogram
      • Parallel coordinate graph
      • Triangular plot
      • Windrose
      • Climograph
      • Population profile
      • Scatterplot
      • Index value plot
      • Accumulative line graph or Lorenz curve
      • Bilateral graph
      • Nominal Area choropleth map
      • Unstandardized choropleth maps
      • Standardized Choropleth map
      • Univariate Choropleth map
      • Bivariate Choropleth map
      • Unclassed Choropleth Map
      • Classed Choropleth maps
      • Range graded proportional circle map
      • Continuously variable proportional circle map
      • DOQQ or Digital Orthophoto Quarter Quadrangle
      • DEM or Digital Elevation Model
      • DLG or Digital Line Graphic
      • DRG or Digital Raster Graphic map
      • Isopleths
      • Isopach
      • Isohyets
      • Isotachs
      • Isobars
      • LIDAR image
      • Doppler Radar
      • Black and White Aerial Photo
      • Infrared Aerial Photo
      • Cartographic animations
      • Statistical map
      • Cartograms
      • Flow map
      • Isoline map
      • Proportional Circle map
      • Dot Distribution map
      • Choropleth map
      • Propaganda map
      • Hypsometric map
    • ►  July (5)
    • ►  June (1)

About Me

Captain Cook's Navigator
View my complete profile